1. Sage has its own built-in graphics. Axes created by Sage are more in line with textbook mathematical presentation with the default x and y-axis. Matplotlib default setup for axes looks more chart-like. Matplotlib’s plotting area and axis area can have different background colors.
2. Python uses indentation for conditional statements, continuation, etc. There is no need to have and ending semicolon at the end of the statement. Data types include lists, tuples, iterations. Iteration loops are much cleaner than C and php.
3. After Sage graphics is created, Matplotlib can be called directly to access options not provided by Sage (minor tick mark control, location and format of grid lines, etc).
4. Sage mathematical functions include gcf, lcm, fraction, f(x), derivative, matrix calculations, etc. This is a superior and much more flexible substitute for hand-held graphic calculator (TI-CAS and HP). Sage notebook and command line works on Android tablet and phone devices.
5. Definition and log files can be loaded or attached in addition to log and session information (see dictionary.sage).
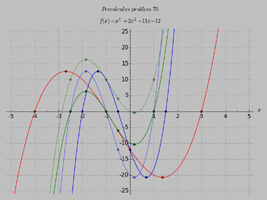
The following graph tests the following options provided by Sage/Matplotlib.
6. Name of properties or functions can be found by typing part of the initial characters and
7. Sage’s image file format does not support .jpg (only .png and .pdf) while Matplotlib offers .jpg support through PIL Python Image Library.
8. latex(f(x)) to convert standard string to LaTex format (can use $string$ to do the conversion).
9. Power of Sage:
Find the roots of quadratic equation:
sage: s=solve(3*x^2+4*x-11==0,x)
sage: s
[x == -1/3*sqrt(37) – 2/3, x == 1/3*sqrt(37) – 2/3]
Check for the number of roots (can set up for real or imaginary).
sage: len(s)
2
sage: s[0]
x == -1/3*sqrt(37) – 2/3
sage: s[1]
x == 1/3*sqrt(37) – 2/3
sage: s[0].right()
-1/3*sqrt(37) – 2/3
Return in 5 digits of 32-bit precision
sage: s[0].right().n(digits=5)
-2.6943
sage: s[0].right().n(prec=32)
-2.69425418
sage: ptx=[0,1,-1,-2]
sage: pty=[2,3,-3,-2]
sage: ptx
[0, 1, -1, -2]
sage: pty
[2, 3, -3, -2]
sage: pts=zip(ptx,pty)
sage: pts
[(0, 2), (1, 3), (-1, -3), (-2, -2)]
sage: pts+=zip([4],[5])
sage: pts
[(0, 2), (1, 3), (-1, -3), (-2, -2), (4, 5)]
sage: pts[0]==[0,2]
False
sage: pts[0]==[(0,2)]
False
sage: pts[0]==(0,2)
True
sage: for ptn in pts: print “(%1d,%1d)”%ptn
(0,2)
(1,3)
(-1,-3)
(-2,-2)
(4,5)
11. Function transformation using matrix.
#Transformation for function, not for point transformation.
def t2dm(sx,dx,sy,dy):
return matrix([[sx,0,-sx*dx],[0,sy,dy],[0,0,1]])
def p2d(x,y):
return matrix([[x],[y],[1]])
def t2dp(M,x,y):
return M*p2d(x,y)
12. Customizations in the following graph.
Phim nguyên thủy ở dạng avi quá lớn bị trục trặc về vấn đề bản quyền.
Đổi sang dạng mp4 làm phim nhỏ lại để tránh vi phạm luật tác quyền.
Chảy máu trong phim chắc là cảnh giả, nữ diễn viên đóng kịch khá giống.